|
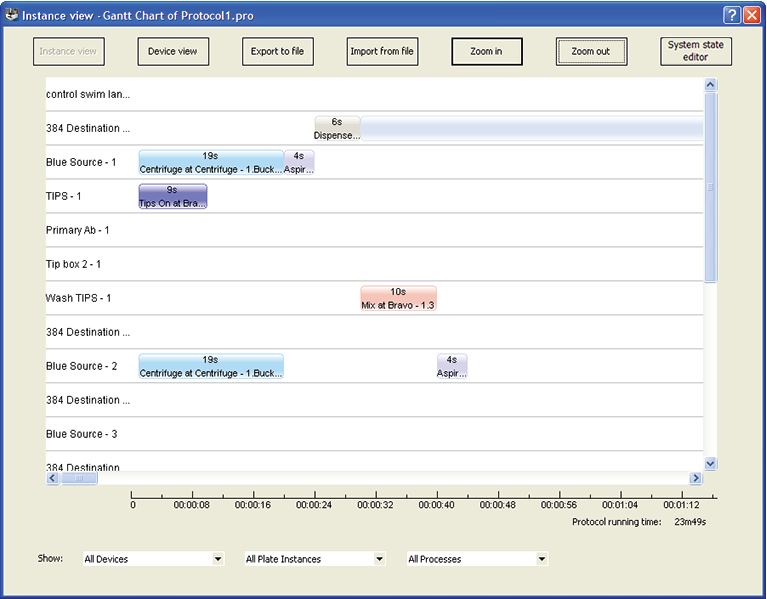
You can display a Gantt chart for one or more protocols while they are running, or for one or more open protocols have been run in the current VWorks session since they were opened.
• In the VWorks window, select Tools > Gantt Charts while a run is in progress, after a run is finished, or when a run has a deadlock error. The Gantt Chart dialog box opens.
Right-click a task in the graph, and then select Edit Parameter. The software minimizes the Gantt Chart dialog box and displays the task within the protocol so that you can edit the parameters.
Note: If you want the System State Editor dialog box to open automatically whenever a deadlock occurs, choose Tools > Options. Under Error Handling in the Options dialog box, choose Deadlock behavior > Show the System State Editor. For more information, see Recovering from deadlocks.
1
2 Select the folder in which you want to save the file, and type a name for the file, and then click Save. A .gnt file is created in the folder you specified.
1
2 Select the .gnt file, and then click Open. The run information appears in the Gantt Chart dialog box.