Tracking the run progress of instances or devices
Displaying the run progress in the Gantt Chart format
You can display a Gantt chart for one or more protocols while they are running, or for one or more open protocols have been run in the current VWorks session since they were opened.
While a protocol is running, you can visually monitor the progress in real-time in the Gantt Chart dialog box. In addition, you have the option of displaying the progress by instance or device.
Run information displayed in the Gantt Chart format enables you to monitor resource usage during the run. Too much spacing (time) between tasks might indicate poor device usage or potential bottlenecks. After you examine the run information, you can:
• Determine the causes of bottlenecks and remove them.
• Add devices or try to run multiple protocols simultaneously to improve performance and throughput.
To visually track the progress of labware instances or devices:
In the VWorks window, select Tools > Gantt Charts while a run is in progress, after a run is finished, or when a run has a deadlock error. The Gantt Chart dialog box opens.
 |
Displaying the progress by plate instance
To display the progress by individual plate instances:
In the Gantt Chart dialog box, click Instance view.
 |
The Instance View presents a graph of the process plate instances (vertical axis) as a function of time (horizontal axis). Each row represents the timeline of a process plate instance. During a run, a row displays the tasks that are performed on a plate instance. The length of the task block represents the duration of the task. The actual duration of each task is displayed on the task block.
Note: A task that does not involve a process plate is not displayed.
If an error occurred during the run, you can use the Instance view to determine the plate instance at which the error occurred. If a deadlock occurred or if the run was aborted, a red X symbol appears on the task at which it occurred.
From within the Instance view, you can double-click a task to edit its parameters.
To edit a selected task parameter within the Instance view:
Right-click a task in the graph, and then select Edit Parameter. The software minimizes the Gantt Chart dialog box and displays the task within the protocol so that you can edit the parameters.
Displaying the progress by device
To display the progress by device:
In the Gantt Chart dialog box, click Device view.
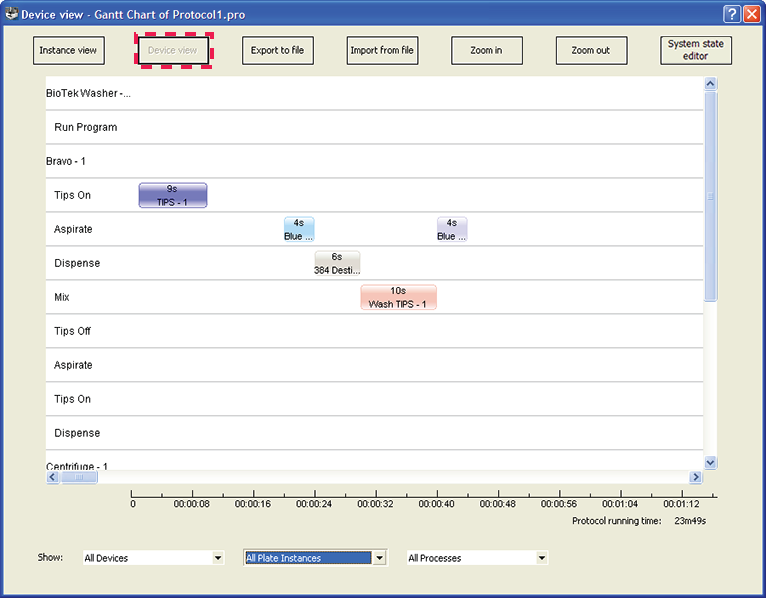 |
The Device View presents a graph of devices (vertical axis) as a function of time (horizontal axis). A row represents the timeline of a device. During a run, each row expands and lists the tasks that the device is performing. The process plate on which the task is performed is shown on the task timeline. The length of the process-plate block represents the duration of the task on the plate.
To optimize the run, look for wide spacing between tasks and determine whether adding devices to the run can improve the throughput. Ideally, the spacing between the tasks should be kept to a minimum.
Zooming the display
You can zoom in or zoom out to change the horizontal (time) scale of the graphs. Each time you zoom in, you are reducing the time increments displayed. Each time you zoom out, you are increasing the time increments displayed.
For example, if the current scale is in increments of 4 seconds, zooming in reduces the increments to 2 seconds. Zooming out increases the increments to 8 seconds.
Note: Zooming has no affect on the scale of the vertical-axis.
To zoom in or zoom out of the current view:
Click Zoom in or Zoom out.
Filtering the displayed information
While in the instance or device view, you can filter the information displayed to focus on areas of interest. For example, you can choose to display the information from a single device instead of all devices in the run.
The filter selections are at the bottom of the Gantt Chart dialog box.
 |
To filter the information displayed in the Gantt Chart dialog box:
1 Select one of the following from the Device list:
Selection | Description |
|---|---|
All devices | Displays all devices used in the protocol. |
Selected devices | Allows you to specify which devices to display in the dialog box. |
2 Select one of the following from the Plate Instances list:
Selection | Description |
|---|---|
All plate instances | Displays all plate instances. |
Completed plate instances | Displays only plate instances that have finished processing. |
Plate instances in progress | Displays only plate instances that are currently in progress. |
3 Select one of the following from the Process Plate list:
Selection | Description |
|---|---|
All processes | Displays all plate processes. |
Completed processes | Displays only plate processes that are finished. |
Processes in progress | Displays only plate processes that are currently in progress. |
Selected processes | Displays only the plate processes that you have selected. |
Opening the System State Editor
You can open the System State Editor to recover from a deadlock error.
To open the System State Editor:
In the Gantt Chart dialog box, click System State Editor. The System State Editor dialog box opens.
For information about deadlock recovery and the System State Editor, see Recovering from deadlocks.
Note: If you want the System State Editor dialog box to open automatically whenever a deadlock occurs, choose Tools > Options. Under Error Handling in the Options dialog box, choose Deadlock behavior > Show the System State Editor. For more information, see Recovering from deadlocks.
Exporting Gantt charts
To export the run information in the Gantt format:
1 In the Gantt Chart dialog box, click Export to file. The Save As dialog box opens.
2 Select the folder in which you want to save the file, and type a name for the file, and then click Save. A .gnt file is created in the folder you specified.
Importing and opening saved Gantt charts
To import the Gantt chart into Shared Services storage:
1 Click File > Import Misc File. The Select a Miscellaneous File for Import dialog box opens.
2 Select the Gantt Chart Files (*.gnt) file type, select the file, and click Open.
 |
3 In the Save File As dialog box, select the storage location, verify the file name, and click Save.
 |
To open an imported Gantt chart file:
1 Click File > Open > Gantt. The Open File dialog box opens.
 |
2 Select the *.gnt file and click Open. The selected file opens in the Gantt Chart dialog box.
To import run information in Gantt format:
1 In the Gantt Chart dialog box, click Import from file. The Open dialog box opens.
2 Select the .gnt file, and then click Open. The run information appears in the Gantt Chart dialog box.
Related information
For information about... | See... |
|---|---|
The System State Editor | |
Monitoring the overall run progress | |
Viewing logs |