Viewing logs
About the logs
The VWorks software records events that occur and stores the information in the following logs:
• Main Log. Contains all of the actions that occur in the software, including changes to device profiles in the diagnostics software. For details on the log contents, see Main Log contents.
• Pipette Log. Contains all pipetting events and error information. For details on the log contents, see Pipette Log contents.
• Time Constraints Log. Contains all information about time-limited tasks. For details on the log contents, see Time Constraints Log contents.
The log text colors can help you distinguish between different types of messages and events.
You cannot edit or delete log entries within the VWorks software, and you cannot change the storage location for the log files. However, you can download copies of the log files from Shared Services storage to a location of your choice.
Log file locations
To display the log file locations:
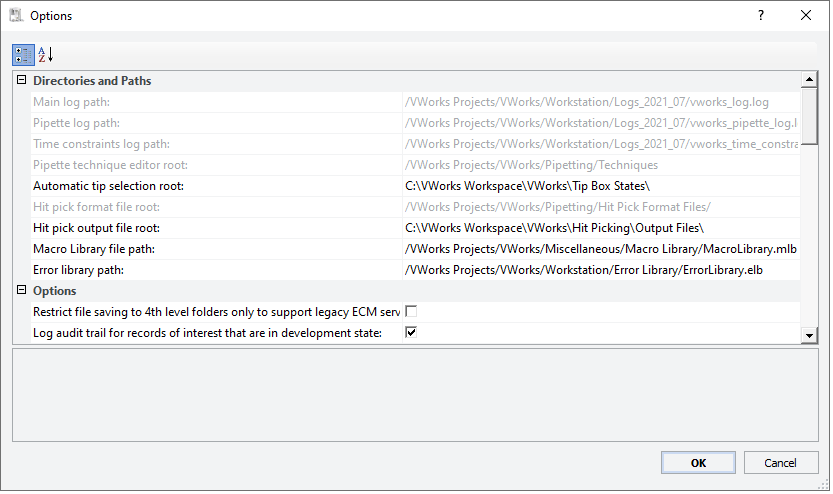
In the VWorks window, click Tools > Options. The Options dialog box opens.
Under Directories and Paths, notice that the Main log path, Pipette log path, and Time contraints log path are grayed, indicating that these paths cannot be changed.
 |
Viewing the logs
You can view the VWorks logs in the following ways:
• VWorks window. You can display the logs for the current VWorks session in the VWorks window.
• VWorks log files. You can display the contents of log files from previous VWorks sessions in the following ways:
– View a downloaded copy of the log file. If you are a VWorks administrator or technician, you can use the Log Management command to save a copy of a log file to a location of your choice. You can use a text editor, such as Notepad, to view the copy of the log file.
– View a log file in the Content Browser. Available only for VWorks Plus, an administrator can use the browser to view files in the Secure Storage repository.
Viewing a log in the VWorks window
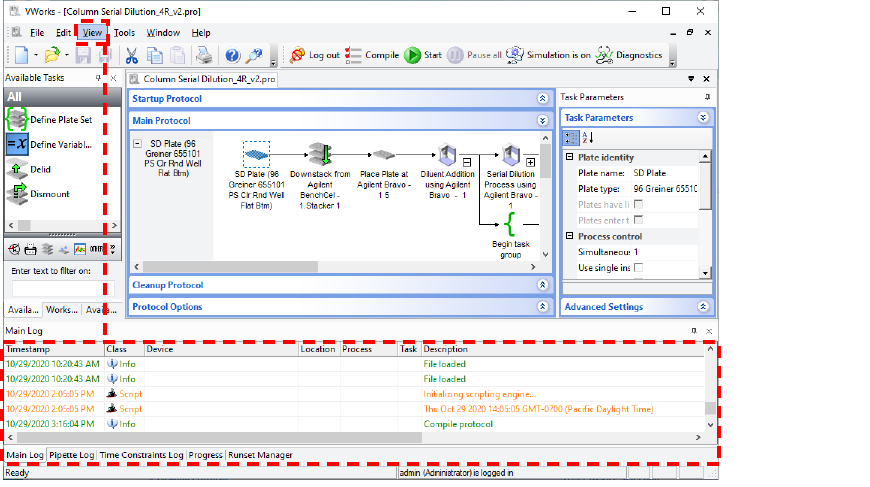
You can view the Main Log, Pipette Log, and Time Constraints Log in the VWorks window. When you exit the VWorks software, the log display is cleared and log files for the session are saved with the date-time stamp of the VWorks startup time for the given session.
To view a log in the VWorks window:
In the VWorks window, select View > <log name>. The log information appears is the corresponding log tab.
 |
Viewing the log file contents
Log files are text files that have the following file naming conventions, where date_time in the file name is the startup time of the given VWorks session.
Type of log | File name |
|---|---|
Main Log | VWorks_log(date_time).log |
Pipette Log | VWorks_pipette_log(date_time).log |
Time Constraints Log | VWorks_time_constraints_log(date_time).log |
To view a copy of a log file:
1 Save a copy of the log file to a location of your choice. See Validating and saving copy of log file.
2 To view the log file contents, locate and select the saved copy of the log file in the Windows Explorer window.
Open the file using a text editor such as Notepad.
(VWorks Plus only) To view a log file in the Content Browser:
1 Start the Content Browser:
Click All apps > Agilent Technologies > Content Browser.
2 Log in using your user name and password.
3 Locate the log file folder in the Repository, for example, /VWorks Projects/VWorks/Workstation/Logs.
4 Double-click the log file, <log name>log(date_time).log, to display the file details for the corresponding log.
Validating and saving copy of log file
To validate a log file and save a copy to another location:
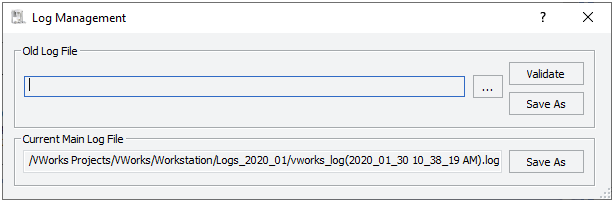
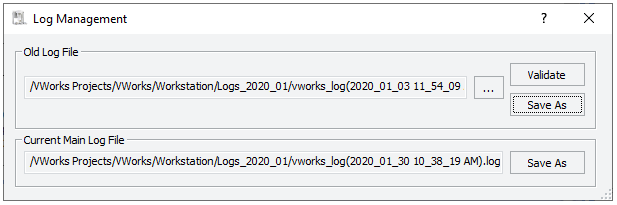
1 In the VWorks window, click Tools > Log Management. The Log Management dialog box opens.
 |
2 Under Old Log File, click  . The Open File dialog box opens.
. The Open File dialog box opens. 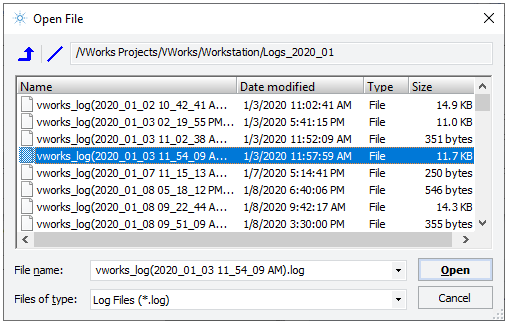 |
3 Locate and select the log file. The path of the selected file appears in the Log Management dialog box.
 |
Note: The log file path locations are listed in the Options dialog box.
4 In the Old Log File area, do one of the following:
• Click Save As. The software validates the selected file to determine if it has been altered or corrupted.
– If the validation is successful, the Save Old Log File As dialog box opens. Type a file name, select a location, and click Save.
– If the validation is not successful, an error message appears and the save as procedure is aborted.
• Click Validate. The software validates the selected file to determine if it has been altered or corrupted.
The software checks the log file and displays a message that explains whether the validation is successful.
Saving a copy of current Main Log
To save a copy of the Main Log for the active session:
1 In the VWorks window, click Tools > Log Management. The Log Management dialog box opens.
|
2 Under Current Main Log File, verify that the log path appears, and then click Save As.
3 In the Save Current Main Log File As dialog box, type a file name, select a location, and click Save.
Main Log contents
The Main Log records all available event and error information. The Main Log contains the following information:
Column name | Description |
|---|---|
Timestamp | Time and date of the event or error. |
Class | The type of event or error message: • Info. General information. For example, System start up, or Simulation mode toggled on. • Event. A software action. For example, Scheduler started, or Move plate. • Error. An error that can stop the software and must be resolved. For example, Location incompatible with labware. • Warning. An error that might permit the software to continue. For example, Task requires that tips be on the pipette head. |
Device | Device at which the event or error occurred. |
Location | Location where the event or error occurred. For example, Bravo location 9. |
Process | Name of the protocol process and subprocess that is running. |
Task | Task at which the event or error occurred. |
Description | Description of the action that is being recorded. |
File name | Name and location of the protocol file. |
Session ID | Login session number. |
Pipette Log contents
The Pipette Log records all pipetting events and error information. The Pipette Log contains the following information:
Column name | Description |
|---|---|
Timestamp | Time and date of the pipetting event or error. |
Class | The type of event or error message: • Event. A software action. For example, when a protocol is started, the event is logged. • Transfer. A pipetting event. |
Session ID | Login session number. |
Volume | The volume of liquid transferred. |
Aspirate Location | The location at which the Aspirate task occurred. |
Aspirate Selection | The wells from which fluid was drawn for the Aspirate task. |
Dispense Location | The location at which the Dispense task occurred. |
Dispense Selection | The wells into which fluid was dispensed. |
Description | The description of the action that is being recorded. |
File name | The name and location of the protocol file. |
Time Constraints Log contents
The Time Constraints Log records any time-limited task events and errors. If you did not specify time constraints, no information appears in the log.
The Time Constraints Log contains the following information:
Column name | Description |
|---|---|
Timestamp | Time and date of the event or error. |
Class | The type of event or error message: • Info. General information. For example, System start up, or Simulation mode toggled on. • Event. A software action. For example, Scheduler started, or Move plate. • Error. An error that can stop the software and must be resolved. For example, Location incompatible with labware. • Warning. An error that might permit the software to continue. For example, Task requires that tips be on the pipette head. |
Session ID | The login session number. |
Start Process | The name of the protocol process or subprocess that contains the first of the two dependent tasks. This field also includes the instance number to help you identify the plate instance. For example, Process - 1 1 means Process - 1, instance 1. Start Process is paired with Start Task to identify the first of the two dependent tasks. |
Start Task | The task number that identifies the first of the two dependent tasks. For example, 1 is the first task in the process, and 5 is the fifth task in the process. Start Task is paired with Start Process to identify the first of the two dependent tasks in the protocol. |
End Process | The name of the protocol process or subprocess that contains the second of the two dependent tasks. This field also includes the instance number to help you identify the plate instance. For example, Process - 3 1 means Process - 3, instance 1. End Process is paired with End Task to identify the second of the two dependent tasks. |
End Task | The task number that identifies the second of the two dependent tasks. For example, 3 is the third task in the process, and 10 is the tenth task in the process. End Task is paired with End Process to identify the second of the two dependent tasks in the protocol. |
Target interval | The time specified in the Edit Time Constraints dialog box. |
Allowed deviation | The time tolerance specified in the Edit Time Constraints dialog box. |
Actual interval | The length of time of the first task during the run. |
Actual deviation | The difference between the Target interval and the Actual interval. |
Error | The result of the following: |Actual deviation| – |Allowed deviation| If the result is less than 0, Error is set to 0. For example: • Actual deviation is 66. Allowed deviation is 60. So Error is 66 – 60, or 6. • Actual deviation is 30. Allowed deviation is 60. So Error is 30 – 60, or –30. Because the result is less than 0, Error is set to 0. |
Description | The description of the action that is being recorded. |
File name | The name and location of the protocol file. |
Log text colors
Text in the logs appear in the following colors:
Color | Description |
|---|---|
Grey | Standard events with a date stamp or operator-added notes |
Blue | Liquid transfer events |
Orange | Warnings |
Red | Error |
Green | General information |
Purple | Debug information (shown only if the Debug log level is greater than 0 in Tools > Options) |
Related information
For information about... | See... |
|---|---|
Audit trails and records of interest | |
Setting system-wide options | |
Exporting and importing protocol and associated files | |
Contacting Agilent and reporting problems |