Using breakpoints to monitor and troubleshoot tasks
About breakpoints
A breakpoint is a point in the protocol where you want the system to pause operation. Adding a breakpoint at a task pauses the run or simulation and opens the Debugger dialog box before the system performs the actual task. The Debugger dialog box provides JavaScript information for the corresponding task.
Breakpoints enable you to do the following:
• You can monitor parameter values and verify the actions of certain tasks during simulation or a dry run, and change the values if necessary.
For example, you can add a breakpoint at an aspirate task to pause the system just before the aspirate task starts. During the pause, you can verify the task parameter values in the JavaScript engine, after the task’s script executes, and before the parameters are applied to the task.
• If you declare your own JavaScript variables for certain tasks, you can monitor the values by placing breakpoints at those tasks.
• You can troubleshoot tasks and fine-tune task parameter values.
• The Debugger dialog box also enables you to write and execute scripts in real time that are not necessarily associated with the selected task.
During the protocol run, the following sequence occurs when the software reaches a breakpoint:
Step | Description |
|---|---|
1 | The protocol pauses at the task with the breakpoint. |
2 | The JavaScript associated with the selected task executes. |
3 | The Debugger dialog box opens and displays the JavaScript for that task. |
4 | In the Debugger dialog box, you can modify values in the JavaScript engine. |
5 | The software applies the relevant task parameters from the JavaScript engine to the scheduler. If you changed task parameter values in the Debugger dialog box, the task will use the updated values when you continue the run. |
6 | You can continue running the selected task and the rest of the protocol or abort the run. |
Note: If the breakpoint is on a task within a loop or if the protocol is run multiple times in one session, the protocol will pause each time it reaches that task.
Figure A breakpoint in a protocol and the corresponding Debugger dialog box
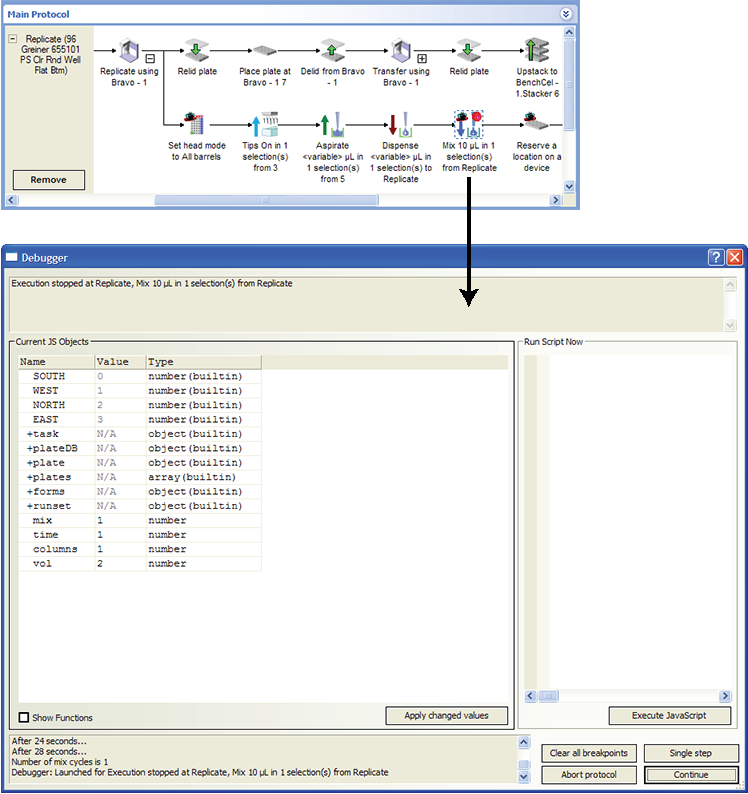 |
Adding breakpoints
You can add as many breakpoints as you want in a protocol. In addition, you can add breakpoints while a protocol or simulation is running.
To add a breakpoint:
1 In the Protocol area, right-click the task at which you want the breakpoint.
2 In the shortcut menu that appears, click Set breakpoint. A red dot appears on the task icon.
 |
Using a breakpoint during a simulation or a dry run
To use a breakpoint in a protocol:
1 Start a simulation or dry run of the protocol that contains the breakpoint. When the software reaches the task that has the breakpoint, the Debugger dialog box opens.
2 Under Current JS Objects in the Debugger dialog box, look in the Name column for the object that you want to view. Click the + symbol next to the object name to view the corresponding properties.
For example, the following figure shows the task object properties for an aspirate task at which a breakpoint was set.
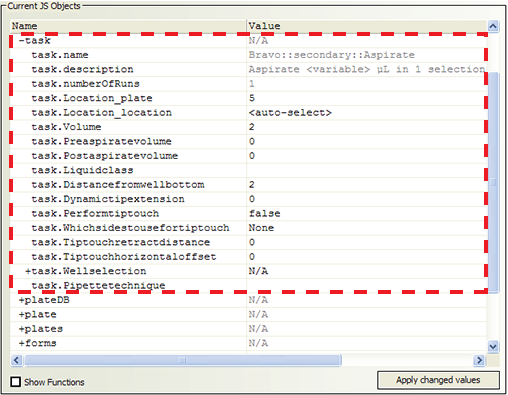 |
Note: To show the functions (methods) as well as the properties associated with the JavaScript object, select Show Functions, and then expand the object in the Name column.
3 In the Value column, change a property value, if required. For example, you might change the task.Volume value from 2 to 3.
4 To apply any changed values without closing the Debugger dialog box, click Apply changed values.
5 If you want to run a script from the Debugger dialog box:
a Type the script in the Run Script Now area.
b Click Execute JavaScript.
The status of the script appears in the bottom left of the Debugger dialog box.
For example, you could type the script runset.clear()to clear all the entries in the runset manager, except for currently running protocol.
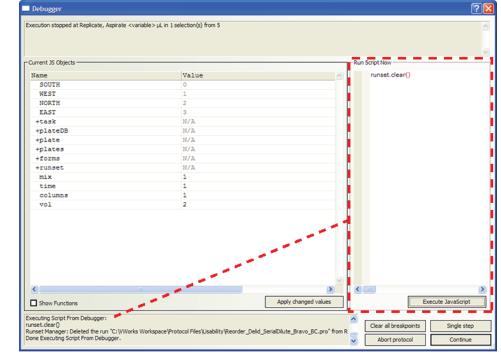 |
6 Click the button in the Debugger dialog box that corresponds to the command you want to use next:
Button | Description |
|---|---|
Clear all breakpoints | Removes all breakpoints in the protocol and continues the run. |
Single step | Permits the protocol to perform one task at a time, pausing before each task. |
Continue | Resumes the protocol run until the next breakpoint is reached. |
Abort | Aborts the protocol run. |
Removing breakpoints from an open protocol
You can remove breakpoints individually or you can remove all breakpoints with one command.
To remove a specific breakpoint:
1 Right-click the task that has a breakpoint.
2 In the menu that appears, click Remove breakpoint.
To remove all breakpoints in a protocol:
1 Right-click any task in the protocol.
2 In the menu that appears, click Clear all breakpoints.
Related information
For information about... | See... |
|---|---|
Compiling protocols | |
Simulating a protocol run | |
JavaScript objects in the VWorks software | |
Tracking the run progress of instances, processes, or devices | |
Contacting Agilent Technologies and reporting problems |